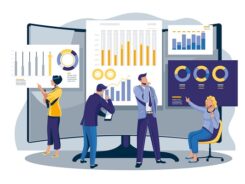
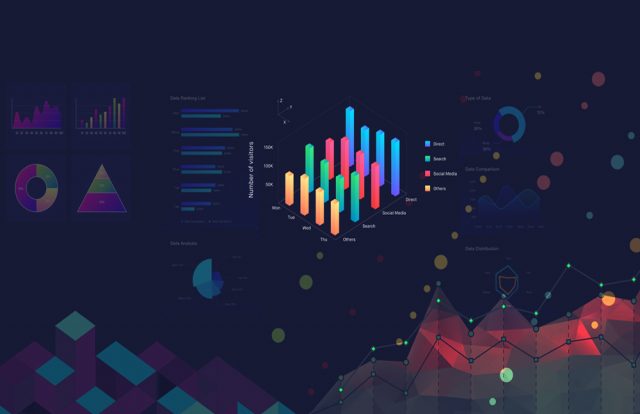
Since data is the new oil in this industry, Data Visualization plays an important role to display the graphical representation of information as well as data. You can visualize all the parameters by analyzing various elements such as graphs, charts, maps, etc. Using this, you can interpret the pattern, the ongoing trends, outliers, etc. So, in this growing world of Big Data, you should have expertise in data visualization techniques and technologies in order to analyze a huge chunk of data and take decisions accordingly.
What is Data Visualization?
The three main branches that house the entire data visualization field covering information visualization, scientific visualization, and visual analytics. From these three points, the main concept of data visualization emerges out. In general terms, the question of what is Data Visualization can be explained in a lucid way. It involves the use of natural science, statistical analysis, interactions, as well as geographic information.
Data Visualization Best Practices
A lot of changes are made in recent years in the field of analytics and machine learning is continuing to reach a peak stage which demands large volumes of data. However, this has made things cumbersome for the data scientists. On the flip side, it increases the necessity for data visualization as well. For that, engineers and analysts are continuously trying to visualize the data using various practices.
Empowering a Particular Group of Scientific People and Address Their Issues
Creating a proper dashboard and positing visualization techniques not only provides a chunk of information to the target group. It is important for the highest priority persona and what challenges they deal with. Focus on the decision you want o put forward to and defining the strategy which can be buying a property, controlling a system, etc. It should be in line with decision making.
Select the Correct Visual
How will you figure out which type of data visualization works for you? Tables can be an important way of formulating all the data sets for those who are looking for higher-level trends.
Using the Line Chart, you can find out the time-age or time-scales relationship-whatever be the business you deal with. Bar charts are available to distinguish between the rates of two quantities. Bubble charts will help in showing the variation of data among the three parameters. There is almost 33% usage of wedge-shaped pie charts as well.
Providing Context
A proper data visualization technique involves a demonstration of the performance with the help of arrows, colors, texts, along with some visual cues. In order to draw a particular conclusion, the viewer should consider important parameters like a goal or a benchmark from the earlier set of records.
Prepare Simple Visualization and Minimalistic Dashboard
Content marketers are always in search of viable content. You want your company to build a dashboard that can induce optimum impact. There are designers who will make your data visualization better through a minimalistic dashboard presentation and the data hierarchy tells stories.
Keeping the Users Engaged Through Proper Design
The latest trend is to coalesce the user’s perspective into insights, suggestions, and predictions. There are tech-oriented business professionals who can drill more into data, but they can’t handle complex data visualization tools or techniques. Through data visualization best practices, you can engage more customers.
Data Visualization Examples
Languages in the World
Through data visualization, you can connect with people belonging to various families, what languages they speak, and view their languages.
US Population as per Age
This is one of the concrete data visualization examples used to put forward a single data in a compelling format. Through this, you can get to know the trend of the US population and which group of people you can look for to drive more customers.
The Entire NFL History
People are not aware of how data visualization is used to know the entire NFL history. It gives the entire data of every day through dates so that people can understand the entire history of the National Football League.
Natural Scenarios
Through data visuals, you can figure out the entire graph of the natural calamities that have taken place in the past and using that you can sort all the adats for future calculations.
Most Important Sports Informations
By visualizing the list, you will get to know the audience response, the number of teams competing, the number of championships won, and many more.
Some Common Data Visualization Tool
There are certain commercial data visualization tools for various practices used nowadays are Tableau and Power BI.
This is an intelligence tool used for analyzing various data visualization operations. It allows the user to make amazing dashboards that can tell them the latest trend and loads of data in the form of graphs and charts.
It tells you proper insight into the variable data practices going on in an organization. Through this, you can visualize the large scale data but the user should have a thorough knowledge of WebGL.
Importance of Data Visualization
The way normal human being stores data in the memory is beyond something else. There you will find the importance of Data Visualization. It involves the skill of normal human beings for the purpose of data processing and gives the company a thorough insight. Using data visualization, you can solve various complex sets of problems.
A proper visualization deals with the process to filter the data and convert it into a tangible visual form and ultimately helps the end-user with the determined trend through charts or graphs. So, the data engineer needs to master the art of different mathematical calculations, statistical algorithms, data modeling, and many more. The proper use of charts and visualization of various business scenarios is important.
Wrapping Things Up
Well, the use of data visualization is manifold. It has crossed all the barriers and intervene in various sectors like automobile, IT, pharmaceutical, civil, aviation, and whatnot. Even medical practitioners and microbiologists are using data visualization techniques to extract more and more information and preparing the growing trend. So, data is the new pathfinder and one should use it in a constructive manner.


