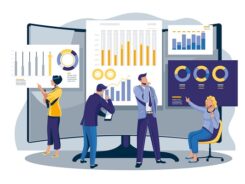
Data visualization is not only a step in the data science process. It is a crucial element of company strategy.
In recent years, companies have begun to rely more heavily on data to drive decision-making, and data visualization has become part of product development. These days, it’s not enough for data scientists to have access to good data. The ability to understand and analyze data empowers employees at all company levels to do their jobs more effectively.
What Is Data Visualization?
Humans are not good at processing large sets of raw data. We are better at comparing, contrasting, telling stories, and interpreting meaning from data. Data visualization is the process of translating a set of data into a digestible, easy-to-understand format. It is the process of telling stories with data.
Although it may seem like a new buzzword, data visualization is centuries old. In the 1600s, Flemish mathematician Michael Florent van Langren was the first person to create a visual representation out of a set of statistics. Since then, data has been turned into charts, graphs, maps, and diagrams to help scientists and laypeople interpret large datasets.
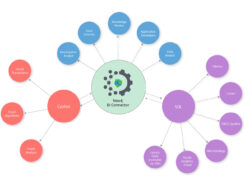
Today, data visualization is a field with many tools available to help translate data sets into understandable formats. Companies like Looker, Tableau, and Qlik specialize in turning data into stories that help people within those companies better understand their customers and products.
Why Is Data Visualization Important?
Data visualization is important because it cuts down on the need for a lot of documentation or lengthy explanations of datasets. In today’s world, agility, communication, and the ability to make decisions based on accurate data are cornerstones of long-term success. Data visualization allows cross-disciplinary teams to quickly and easily communicate findings, so adaptation can be swift and effective.
The main benefits of data visualization include:
- The ability to quickly communicate insights and key findings with non-technical team members
- Effective communication with customers
- No need for a dedicated data team
- The ability to leverage machine learning to drive production forward
Data Visualization and Product Development
More companies are discovering that successful product development requires a product mindset and a DevOps architecture. Let’s look at how data visualization drives these two approaches and results in better product development outcomes.
Product Mindset
A product mindset emphasizes a long-term approach to product development, as opposed to a milestone-based approach. The product mindset is rooted in the tenets of the growth mindset, where employees are encouraged to “fail fast,” “embrace change,” and “continuously evolve.”
A product mindset involves releasing incremental changes to a product and then monitoring the results of those changes. It requires a continuous dialogue with consumers to solicit feedback and understand how the product impacts them.
A key component of adopting the product mindset is utilizing data visualization to communicate findings to team members and stakeholders. Once you collect data from users, you must analyze it before you can use it to drive future decisions. Data visualization is critical in allowing all team members to understand the next steps in a product’s evolution.
DevOps
DevOps architecture is a way of structuring teams to encourage agility, cross-functional collaboration, and faster product development. It encourages engineers, designers, product managers, data scientists, and other stakeholders to partake in all stages of the product’s development.
Data visualization is one part of the toolchain that makes the DevOps architecture work smoothly. By providing an analysis of product feedback and performance that all team members can understand, communication is improved and development happens more efficiently.
Data-Driven Product Development Outcomes
Approaching product development from a data-driven standpoint and a product mindset is sure to bring impressive outcomes.
Organizations that emphasize collecting and analyzing data about their products show up to 83% increased revenue over companies that do not. On top of that, companies that rely on data can better define expected outcomes and create success metrics for themselves.
Using data to drive product decisions is a beneficial cycle: the more data you collect, the more accurately you can measure success. The more accurately you can measure success, the more data you can collect.
Four Steps for Implementing Data-Driven Product Development
Decompose
In this step, you break down your strategy into measurable outcomes. You must define success metrics and understand what you hope to achieve with your product.
Divide
Define the targets of each team’s product in terms of how it will affect reaching the desired outcomes. When all of the individual outcomes are added together, they should equal what the organization as a whole hopes to achieve.
Determine
Prioritize the features that will contribute to desired outcomes. Always go for an MVP-first approach, followed by observation and monitoring of results.
Discern
This is by far the most important step in data-driven product development. Take time to measure performance to understand if desired outcomes have been met. This is where data visualization tools can be most helpful. After analyzing performance data, redefine goals and start again. This is meant to be a continuous, cyclical process.
Tools for Data Visualization
Some of the best tools for data visualization include Looker, Tableau, and Qlik. All three are cloud-based platforms that make data accessible and actionable.
With these tools, AIdriven data analysis can happen in near real-time, and beautiful data visualizations make your data come alive for everyone on your team. The best Qlik Sense extension for data visualization can be found by checking out VizLib, which keeps a running list of some of the best data visualization solutions available.
Conclusion
Data visualization can help drive product development outcomes by providing a way to analyze and measure the effects your product has on the market. It allows you to turn subjective user feedback into objective, actionable statistics.
Data visualization democratizes data and provides a roadmap for future decisions for employees at all levels of an organization. When everyone in the company understands where the ship is heading, it is much easier to turn the ship.


